At a glance, with a daily timeframe, we can notice that the cross broke the previous support (see the yellow ellipses). The support is composed of two bottoms.
The two bottoms represent also a past resistance that was broken by the cross with a bullish candle, on July 2017. The trend is bearish, highlighted by a red candle. There is a rejection from 127.62.
The downtrend is confirmed also by the bearish trendlines (see the second chart).
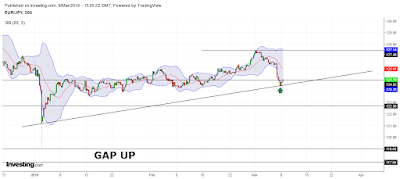
However, in the short-term, the is a test of the bullish trendline.
In this way, it needs other confirmations, to set up a short strategy. Let's look at the next trading sessions. If the bearish trend will be confirmed also in the short-term, the cross could test 122.68, the gap up and then 115,22 (see the trendlines).
 |
| Chart from Investing.com |
 |
| Chart from Investing.com |
With a closer look, the situation is the same: the bearish trend, the price levels highlighted by the yellow ellipses, a red candle that brokes the support, a test of the bullish trendline.
We can notice also the EMA cross (20, 100). The last one represents a sell signal that must be confirmed for the above reasons.
 |
| Chart from Investing.com |
 |
| Chart from Investing.com |
To conclude, for a valid short strategy, we need more information provided by the technical indicators. Otherwise, the last red candle could represent only a volatility exhaust and a rebound of the cross. For this purpose, look at the BB and at the green arrow. The cross is testing the supports in the short-term, even if the trend is bearish in the long-term.
 |
| Chart from Investing.com |
No comments:
Post a Comment
Note: Only a member of this blog may post a comment.