In the building of a trading strategy, the liquidity is a crucial variable.
Secondly, the liquidity can be both a positive and a negative factor.
Of course, we have two market scenarios :
- An illiquid market ;
- A liquid market.
In the first one, from the negative point of view, the price of a stock hardly represents the intrinsic value : in other words, the stock price will reflect poorly the underlying drivers of the fundamental analysis. The same is also for the technical analysis. The stock price doesn't correctly respond to the graphic signals. This bias can last for a long time and sometimes the gap cannot be solved.
In this way, the market context is artificial.
From the other point of view, we can use that fault to our advantage. That means that it needs to follow the next steps of the market maker. If on one hand, the market maker (aka MM) easily moves the price for lack of liquidity, on the other, we must not suffer this but we must make ourselves part of it.
In the second scenario, there is not the abovementioned bias because the market price responds quickly to the underlying factors (technical or fundamental). However, we cannot use to our advantage the previous fault. The market context is normal.
Finally, the first scenario is difficult to manage than the second one because the illiquid market is difficult to interpret. Neverherless, if we are be able to follow the MM's moves, this will lead to higher profits for the reason that the stock price is much more influential to price changes in the face of low traded volume, due to the market structure.
After this introduction, it is useful to indentify the two scenarios (1. and 2.) and above all the magnitude of the price influenceability.
The following methodology shows that. The steps are :
- Building the daily returns (%) for a time period (in general, one year is appropriate) ;
- Building the daily trading volumes ;
- Pondering the first one with the second one ; in other words, we consider the ratios (the daily returns are as absolute returns ; we are interested in the amplifying effect and we are not interested in the direction of the effect). The formula is :
[Absolute Price Change %] / [Trading Volume]
The Absolute Price Change % is equal to ABS(Price Change %)
Finally, we calculate an average value of the previous ratio (=AVERAGE[Absolute Price Change %] / [Trading Volume]). Then, we multiply the average ratio for different and hypothetical volume levels. In this way, we can get an idea of the influence of volume on stock price (-> we get the hypotethical price changes % for given volumes).
Of course, this represents the market structure and it should not be considered as a correct value a priori. There are many variables that can change the survey data and the past trend is not like the future trend : the trading book and the market environment are some factors.
In the following chart, we have an example of illiquid market. The stock is COVER 50 S.p.A., a classic example of illiquid stock. The daily volumes are low and we can notice that it needs just a small volume to get a considerable price change (for a trading volume of 1K we have a price change % of 3.48%).
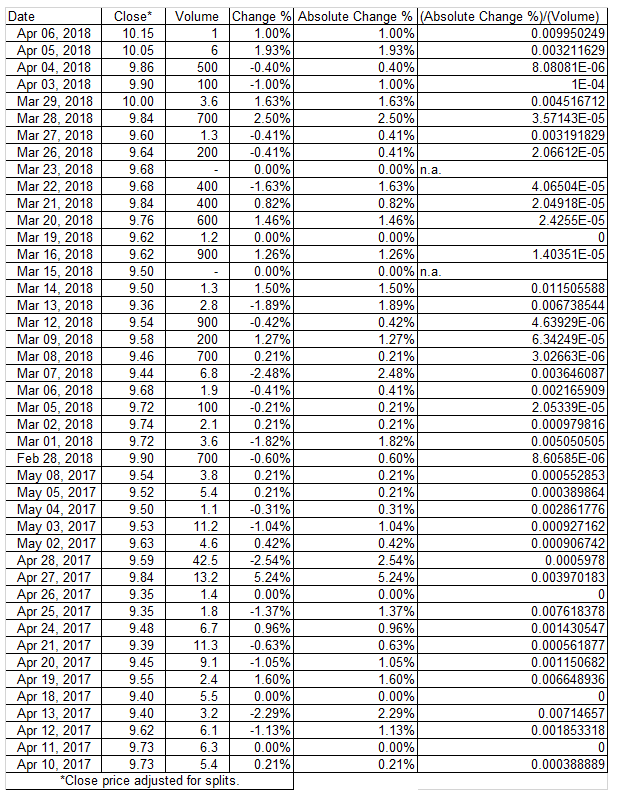 |
| Daily Returns, from April 10, 2017 to April 6, 2018, hidden cells for space requirements, data source : Yahoo Finance |
We can also analyse the abovementioned effect through a regression line.

In the following charts we have an example of liquid market, the stock is UNICREDIT S.p.A.
The daily volumes are huge and in this way it needs a huge volume to get a substantial price change (indeed, for a trading volume of 1K we have a price change % of 7.85189E-07).
For obvious reasons, the slope of the regression line is lower than the previous one.
 |
| Daily Returns, from April 10, 2017 to April 6, 2018, hidden cells for space requirements, data source : Yahoo Finance |

No comments:
Post a Comment
Note: Only a member of this blog may post a comment.